You should spend about 20 minutes on this task.
The line graph below gives information on cinema attendance in the UK. Summarize the information by selecting and reporting the main features and make comparisons where relevant.
Write at least 150 words.
FOR VIDEO EXPLANATION: https://youtu.be/npg91cdxXx4
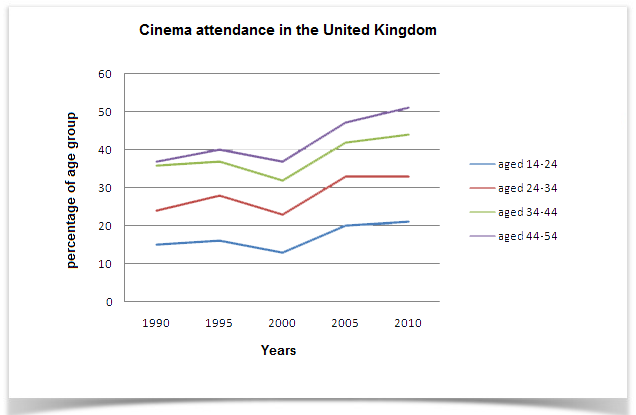
Data regarding the cinema attendance is the United Kingdom between 1990 and 2010 is depicted in the given line graph
Overall, it is clear that despite a fluctuation in the middle, the trend was progressive over the period.
As per the chart, in 1990 attendance to the cinema was more among people between 34 and 54, which was almost 36%. The rate of attendance of UK’s residents to the cinema of the age group 24 to 34 was 24, which was almost 10% more than the the youngest age group’s (24-34).
Despite an increase in 1995, the attendance rate dipped notably in 2000 among all age groups, except the oldest. The percentage of people who went to cinema in the UK this year can be sequenced as 37, 33, 23 and 13 from the oldest to the youngest age group. The next decade saw an erratic incline in the cinema visits. For the older age groups (34-54 years), this ranged between 34 and 51%, whereas among the younger age groups (14-34 years), the proportions stood between 12 and 32.
Word count: 156