


MODEL ANSWER>>>
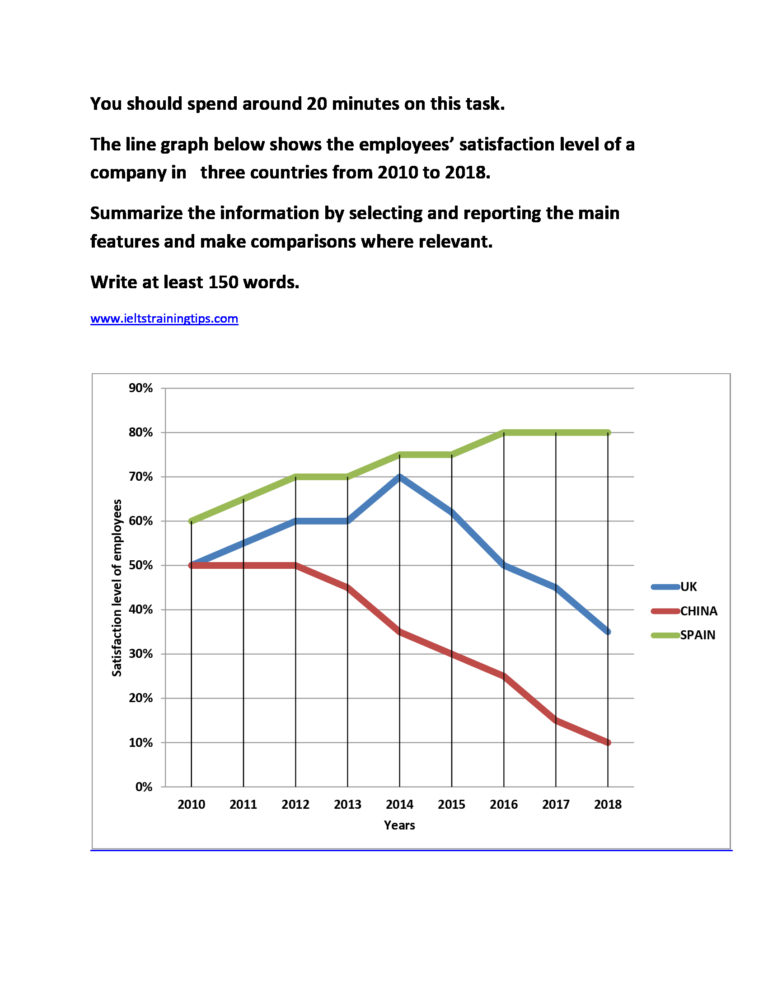
An assessment on the level of satisfaction of a company’s employees in three different countries from 2010 to 2018 is depicted in the given line graph.
As per the graph, the company in Spain recorded the highest level of contentment over this period. In 2010, this level was 60%, which was 10% higher than that of the employees of the same company in the UK and China. When the rate of employee satisfaction went up by 10 in Spain by 2013, the proportional discrepancy looked static between it and the UK. However, this widened by nearly 25% between Spain and China.
The UK recorded its maximum satisfaction level in 2014 (70%), but this started reversing throughout the rest of the period. The condition is China was very similar to the UK’s during this period, when its employee satisfaction level touched a nadir of 10% in 2018, which was approximately 25% less than that of the UK. However, by 2016, 80% of employees in Spain felt were found satisfied and it remained unchanged till 2018.
Overall, it is clear that the most favorable atmosphere for the company’s employees was in Spain, whereas this was the opposite in case of China, over this period.. However, in the UK, the trend was fluctuating.
Word count: 194