


You should spend about 20 minutes on this task.
The line graph below shows the number of marriages in Thomas Island between 1951 and 2009. Summarize the information by selecting and reporting the main features and make comparisons where relevant.
Write at least 150 words.
MODEL ANSWER>>>
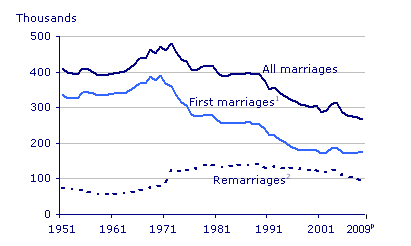
Data denoting the marriages, including both first and remarriages in Thomas Island from 1951 to 2009 is depicted in the given line graph.
Overall, it is clear that the total number of marriages declined in the Island over the years, with a significant fall in case of first marriages.
As per the graph, the volume of first marriages, though there was a decline towards the end, could stay above the number of remarriages all through the period. Between 1951 and 1971, the total numbers of marriages were between 400,000 and 480,000, of which remarriages occurred only in about 60,000 to 100,000 cases. From a peak volume of about 395,000 in 1971, the occurrence of first marriages started becoming less frequent to hit a recorded figure of about 180,000 in 2009.
On the other hand, after 1971, the number of remarriages rose above 100,000 and remained at an average of 130,000 till 1991. It then started declining and fell back to just below 100,000 by the end of the period.
Word count: 152