You should spend about 20 minutes on this task.


You should spend about 20 minutes on this task.
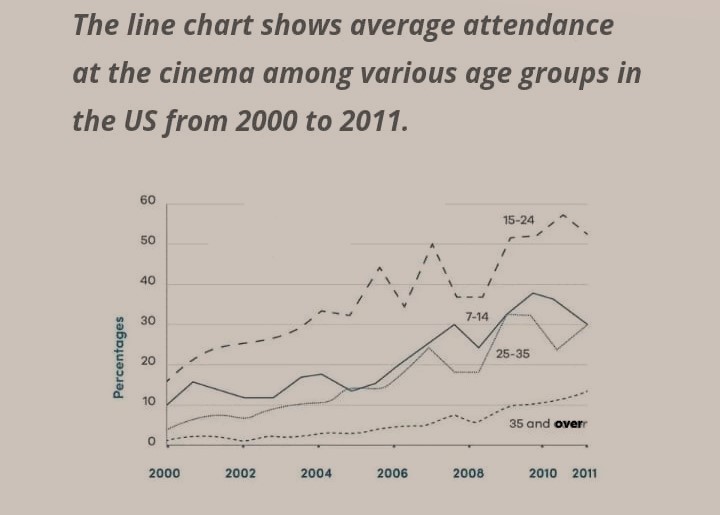
The given line graph compares the typical rate of people who attended the cinema in the US between 2000 and 2011.
In general, the rate was climbing over the years. It is also obvious that the proportion of attendance was seen falling as the age advanced, except in case of the youngest age group.
As per the chart, the percentage of people who attended the cinema was under 20 in case of all age groups in 2000.In case of viewers who were between 15 and 24, the rate spiked twice to 44 and 50 in 2006 and 2008 respectively from just 15 in 2000. After a small slump, it went up again and hit a record high of nearly 57.
The pattern of attendance of the youngest age group (7-14) and the middle age group (25-35) was more or less similar. The percentage of people who attended the cinema from this group fluctuated between 5 and 38, which was mostly dominated by the younger group. The oldest group, 35 and over, had not shown much interest in cinema viewing, and their attendance had not crossed even 10% until 2010.
Word count: 170
FOR VIDEO EXPLANATION: https://youtu.be/FJ_putvstpE