You should spend about 20 minutes on this task.
The pie chart below shows the proportion of child labour in various sectors across the world in 2011.


You should spend about 20 minutes on this task.
The pie chart below shows the proportion of child labour in various sectors across the world in 2011.
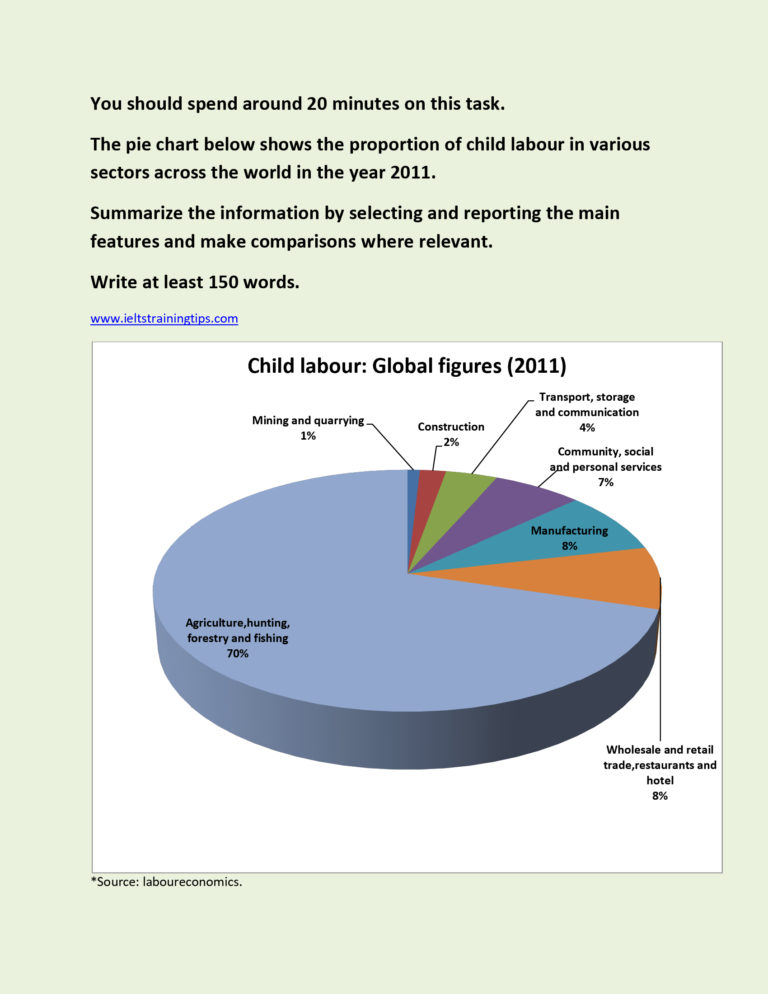
Information regarding the percentage of children employed in various sectors worldwide in 2011 is portrayed in the given pie chart.
Overall, it is clear that agriculture and related sectors employed far more children across the world than the commercial and social sectors.
As per the information gathered by laboureconomics in 2011, most child labour was reported in the fields of agriculture, hunting, forestry and fishing, which accounted for 70% of the total children employed. When wholesale, retail trade, restaurants and similar sectors engaged less than a tenth (8%) of the total child labourers globally, which was excatly the same proportion of children staffed in the manufacturing sector, it was a per cent less (7%) in community, social and personal services.
Out of the remaining 7%, around 4% of children were found employed in transport, storage and communication, whilst only 2% worked in the construction areas. The least proportion of child labour was reported in the mining sector, which was merely a per cent of the total.