


MODEL ANSWER>>>
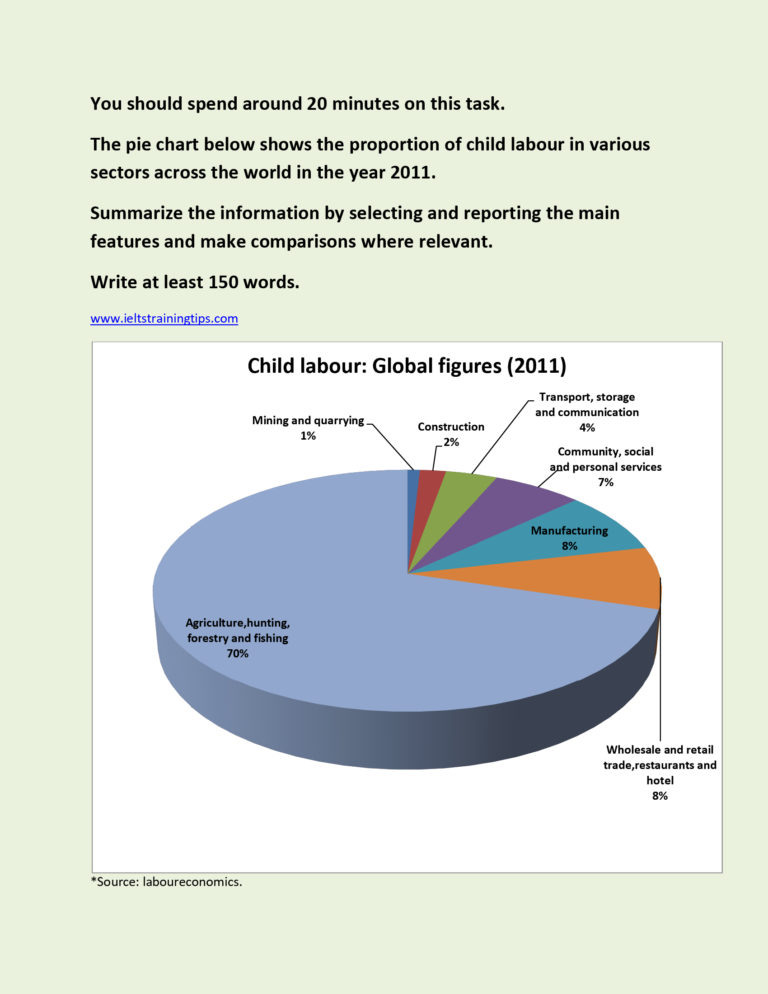
Information regarding the percentage of children employed in various sectors worldwide in 2011 is portrayed in the given pie chart.
Overall, it is clear that the distribution of labour pattern of children varied widely across the world in the given year.
As per the information gathered by labour economics, in 2011, most child labour was reported in the fields of agriculture, hunting, forestry and fishing, which accounted for almost three-fourth of the total (70%).
Out of the rest 30%, wholesale and retail trade, restaurants and similar sectors employed 8% children, and this rate was exactly the same in the manufacturing industry.
Out of the total children laboured worldwide, the rate of those who were employed in community, social and personal services, this was just 7%, which was 3% more than those who were found employed in transport, storage and communication.
Only 2% of them worked in the construction areas and the least proportion of child labour was found in mining (just 1%).
Word count: 153