


MODEL ANSWER>>>
The given charts are the pictorial representations of the major accident causing factors among the Cox town residents and their accident statistics in three distinct years (1990, 2000 and 2010).
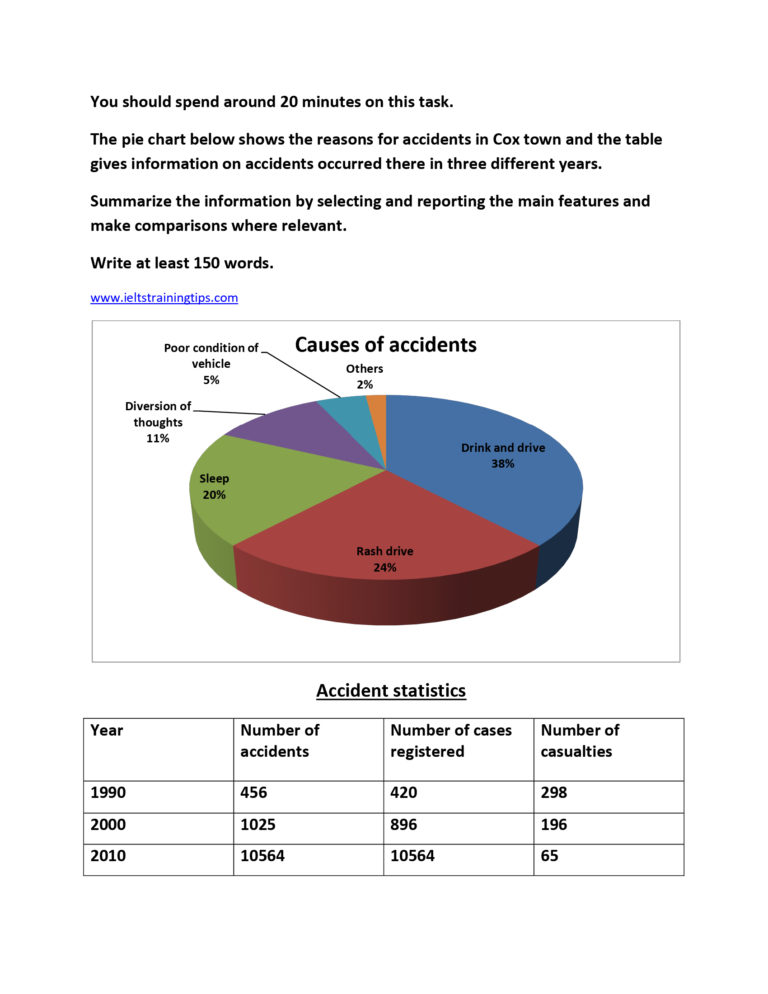
Overall, when drink and drive remained as a major cause of accidents in Cox town, the actual and reported accident numbers were inversely proportional to the number of casualties.
As per the chart, most accidents in Cox town occurred either due to drunken or reckless driving. This collectively accounted for 62% of the total. Approximately two-fifth of the accidents were related to the former reason, whilst the latter caused almost a quarter. Exactly a fifth of the accidents happened due to sleeplessness, which was almost double than that of accidents due to thought diversion. Other factors such as poor condition of vehicles contributed an insignificant proportion of accidents (7%).
As per the table, over these three years (1990, 2000 and 2010), when both the number of accidents and the number of cases reported surged, a declining trend can be seen in the number of casualties. The number of accidents climbed steeply from 456 in 1990 to 10564 in 2010. This growing trend was very similar in case of the cases registered between these years (420-10564). By contrast the casualty numbers fell from 298 to just 65 during these years.