


MODEL ANSWER:
Fluctuations in the rate of imported seafood to the UK from three countries and its total value between 1987 and 2007 are depicted in the given charts.
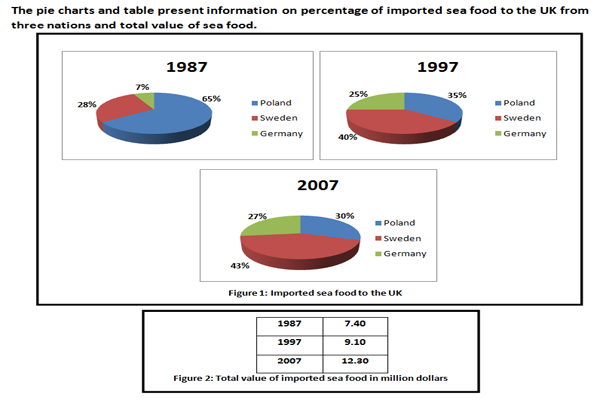
Overall, it is clear from the charts that proportion of imports from these countries had fluctuations, and there was a definite growth in the value of these imports over the period.
Turning to the pie charts, in 1987, the imports were made the most by Poland, at 65%, which was 37% more than the imports from Sweden. The contribution of Germany in the import share was just 7 in this year.
By 1997, the picture had changed, when Sweden replaced Poland to become the topmost country which did the business. Poland, on the other hand, lost its share by almost a half (65 to 35).The growth in the share of its imports was 12 from 28% in 1987. The biggest gainer was Germany, when it made a growth of thrice more than its imports in 1987 to make its share a quarter of the total.
Situations had not changed much in 2007. Sweden and Germany increased their business by 3 and 2% respectively, while Poland’s share shrank further (by 5%).
In case of the total value of imports, there was a growth of 4.8 million dollars since 1987.