You should spend about 20 minutes on this task.
The pie charts below show electricity generation by source in New Zealand and Germany in 1980 and 2010.
Summarise the information by selecting and reporting the main features, and make comparisons where relevant.
Write at least 150 words.
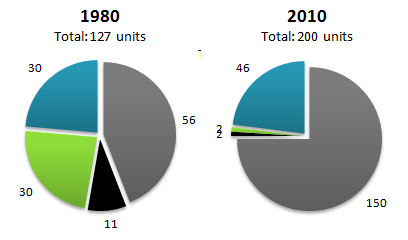
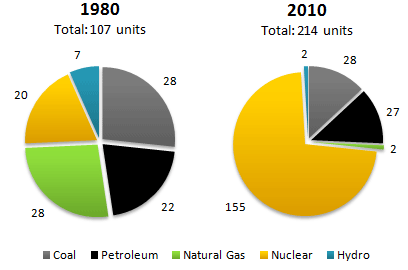
The way in which New Zealand and Germany differed in their dependence on five sources of energy in 2010 compared to how it was in 1980 is depicted in the given charts.
Overall, it is clear that energy consumption in both countries inclined between the years, with Germany surpassing New Zealand in the latter year focusing on nuclear energy.
In 1980, out of the 127 units consumed, almost half of the energy in New Zealand was from coal (56 units). Hydro-electricity and natural gas constituted 60 units of its consumption, in equal proportions. Just 11% was from petroleum sources. In Germany, coal and natural gas supplied most energy out of the total 107 units, with 28 units each, whereas petroleum and natural gas supplied 22 and 20 units respectively
In 2010, when New Zealand’s consumption rose to 200 units, coal still remained as the major source, with three-fourth of the total energy consumed. When there was no proportional difference in the usage of hydro-electricity, energy consumed from the other sources reduced to just 2 units each. Out of the total 214 units consumed in Germany, nuclear energy became the major contributor, with almost 75% of total. Out of the rest quarter, coal and petroleum were supplied 28 and 27 units respectively.
Word count: 193