


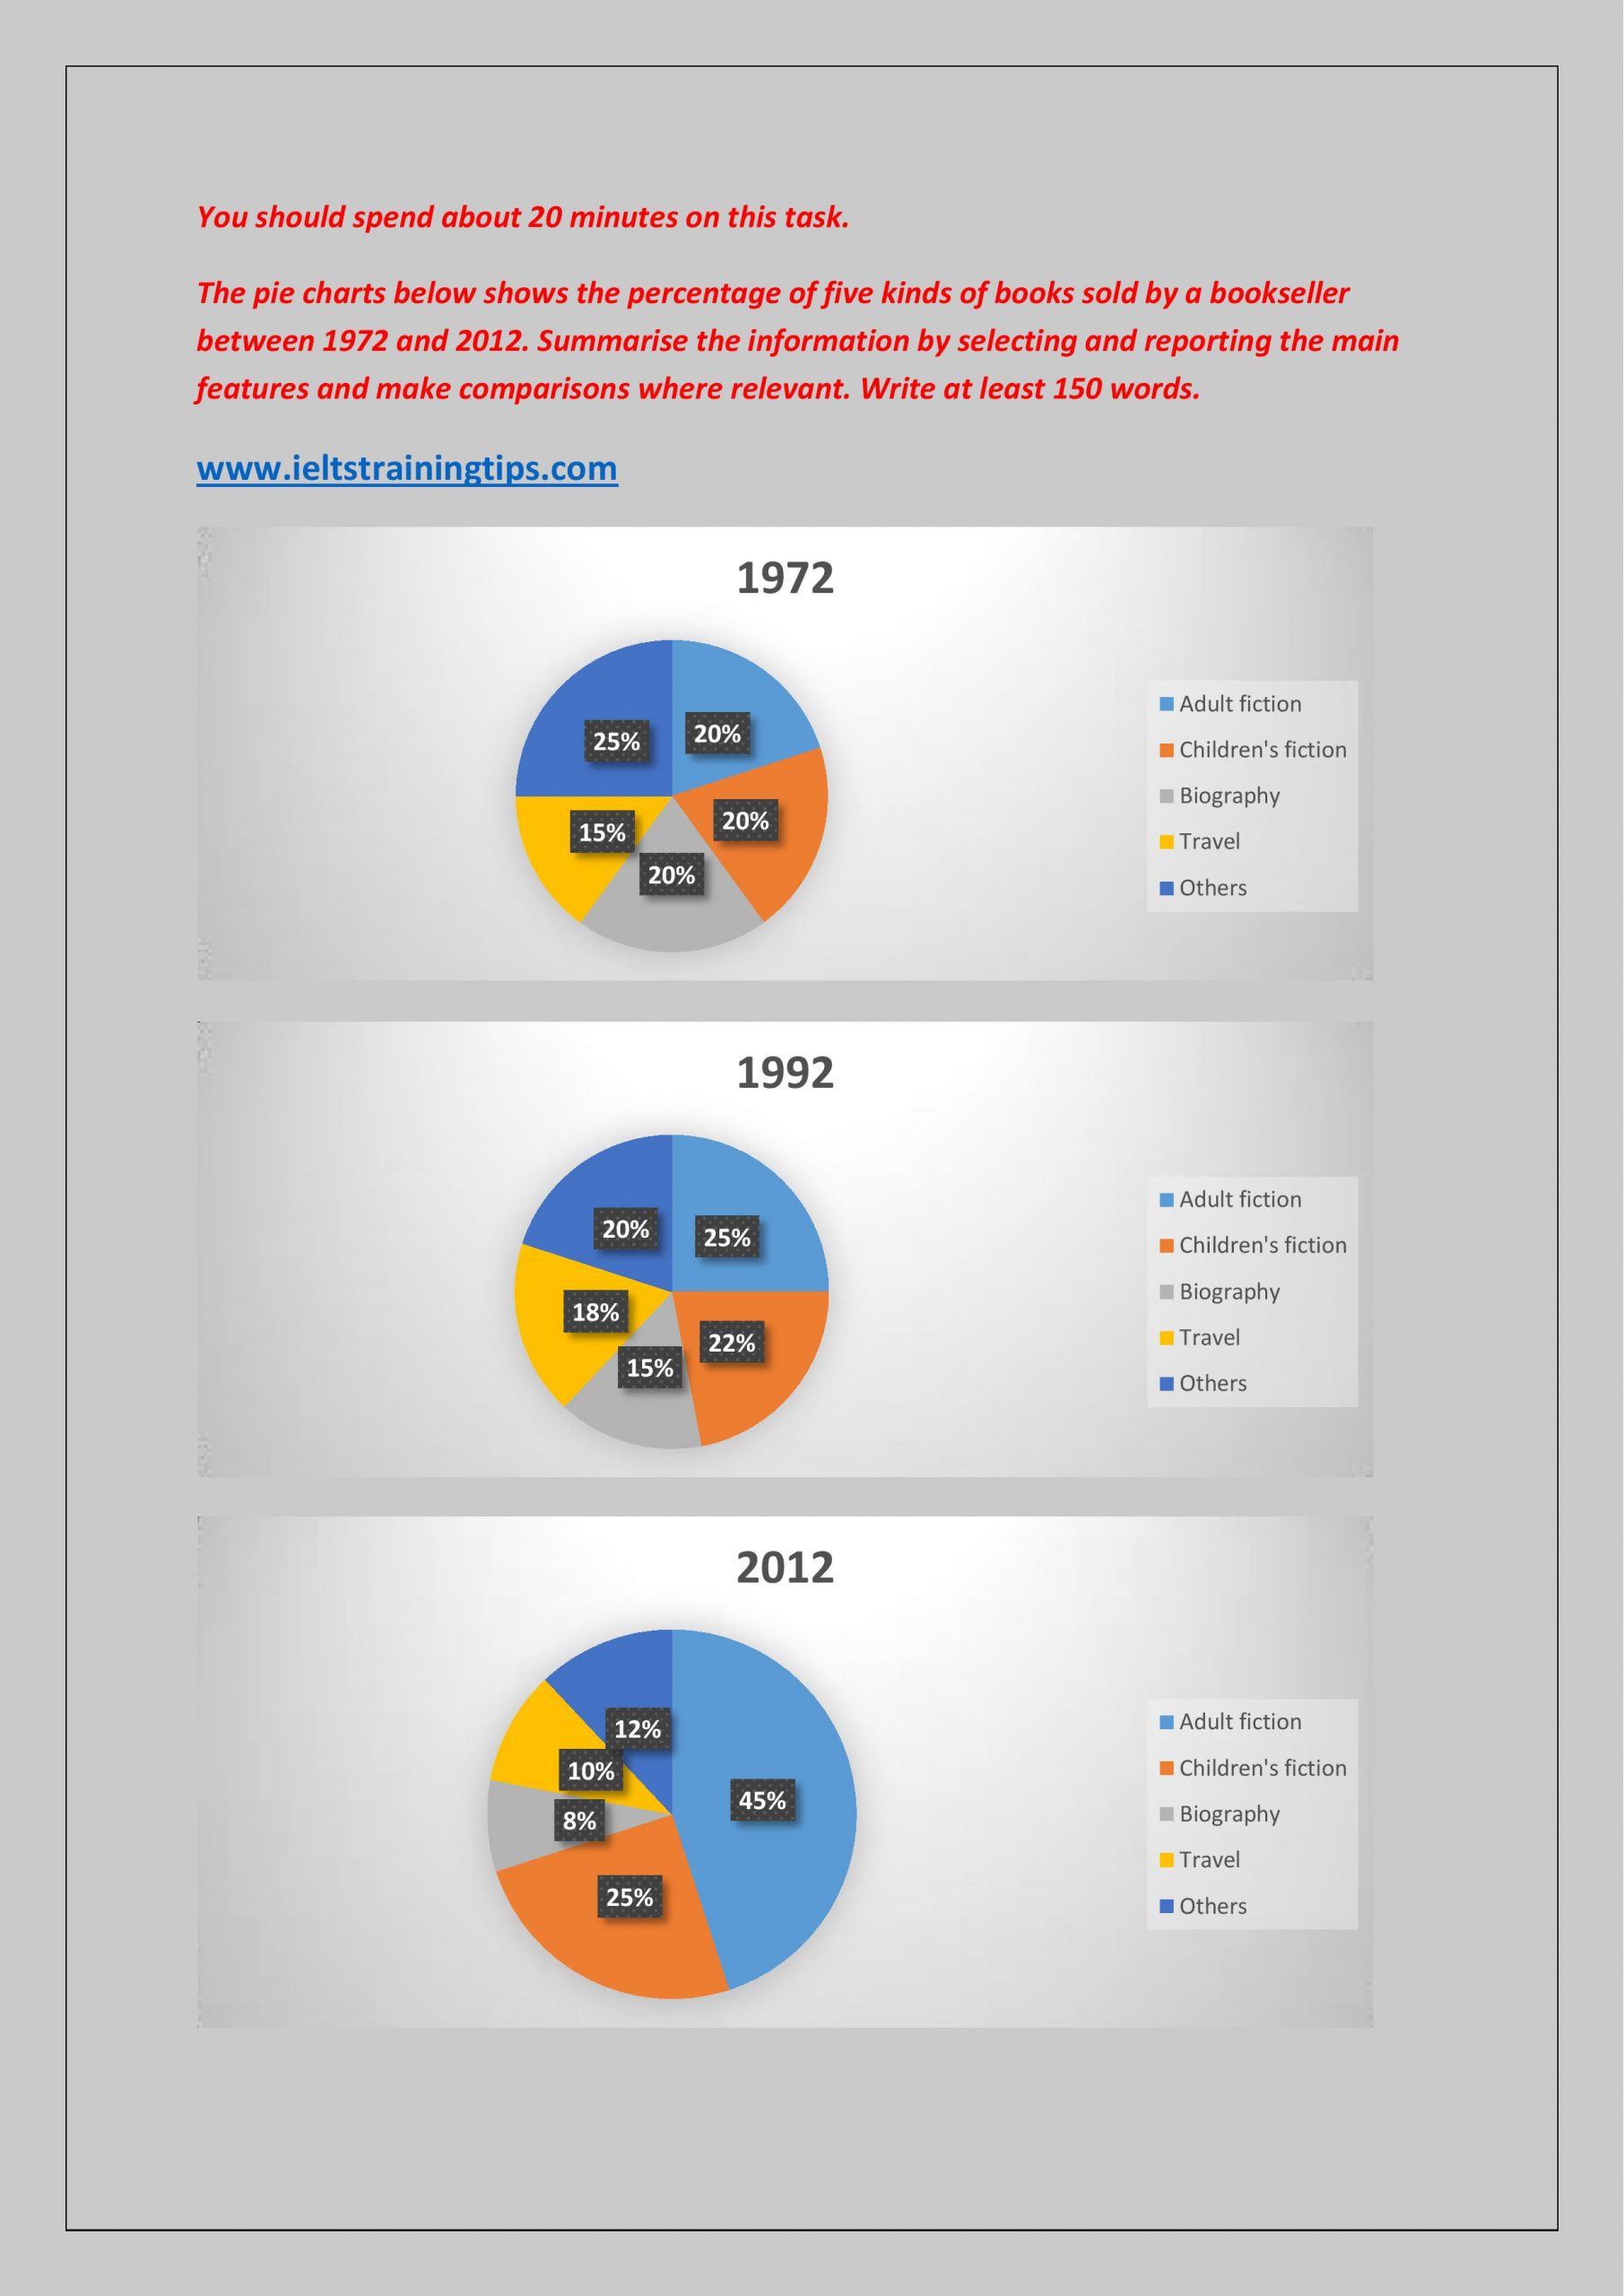
Differences in the pattern of sales of different genres of books sold by a specific bookseller in 1972, 1992 and 2012 is depicted in the given pie charts.
Overall, it is clear that when books of fiction were best-sellers, the sales of other genres exhibited a mixed response.
As per the charts, fiction books dominated the sales in all three years. In 1972, its share was exactly two-fifth of the total. By 1992, this increased by 7% and by 2012, it hiked to nearly three-fourth (70%). Out of these shares, in 1972, 20% were adult fiction books. In 1992, it went up by 5%, and by 2012, by 20%. The rate of sales of children’s fiction books was from 20 to 25 over the 40 year-time period.
The proportion of sales of travel books, on the other hand, showed a decline over the period from 15 in 1972 to 10% in 2012, despite a growth in 1992 (18%). However, the sales of biographies and other books declined by over a half. In 2012, the sales of biography books was just 8% and other books was 12%.
Word count: 160