You should spend about 20 minutes on this task.
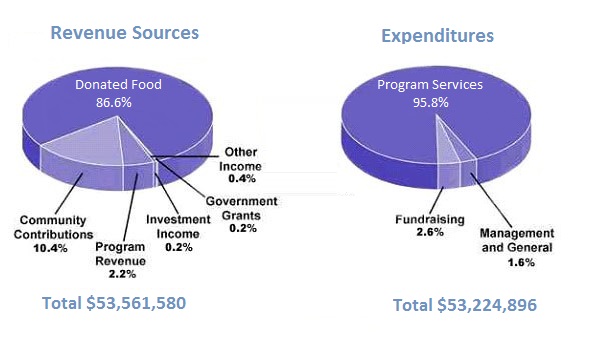
The pie charts show the amount of money that a children’s charity located in the USA spent and received in one year.
Summarise the information by selecting and reporting the main features and make comparisons where relevant.
Write at least 150 words
Data regarding the sources from which a children’s charity in the USA obtained money and the areas to which it had to spend money in a particular year is elucidated in the given pie charts.
Overall, it is clear that the charity firm had a surplus budget in the particular year, and had several contributors for funding.
Turning to the sources of revenue, the lion’s share of the total $53,561,580 came from donated food, which accounted for 86.6%. The second major area it generated the fund was from community contributions, which was just over a tenth of the total (10.4%). Program revenue, investment income, government grants and other contributions constituted just around 3% of the revenue.
In case of the break-up of the total expenditure, out of the total $53,224,896, the major share was allocated to meet the program services. This accounted for 95.8%, whereas just 2.6% of the charity’s income went to fundraising purpose. The least share of disbursement was to meet management and general expenses (1.6%).
Word count: 160