MODEL ANSWER:
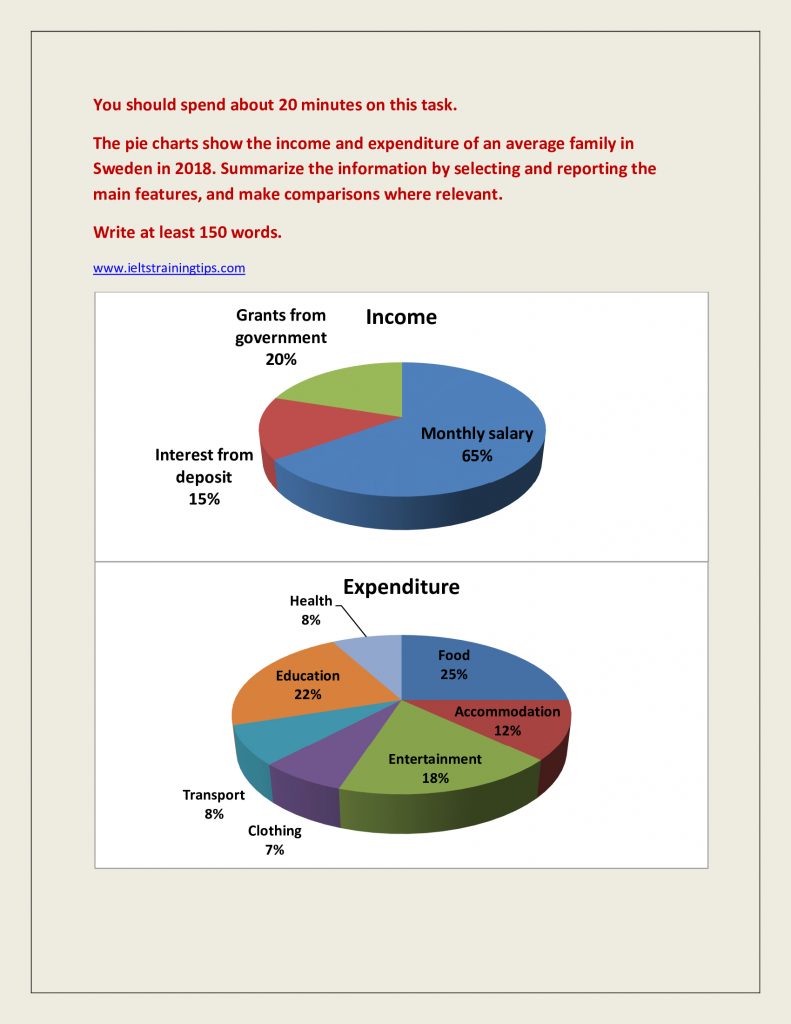
The pie chart gives information about the average income and expense of a family living in Sweden in the year 2018.
Overall, the highest source of income was contributed by their monthly salary, whereas people in Sweden spent most on food.
About two- third (65%) of the Swedish people’s income was generated from their monthly salary, whereas incentives from the government made up almost one-fifth of their total earning. Around 15% of the income came from the interest received from bank deposits.
A major part of expenditure by people in Sweden was channeled to food and educational sectors. Swedish people spent a quarter of their income on food and 22% on their children’s education. Expenses related to entertainment and accommodation made up 18% and 12% respectively. Interestingly, the money spent on healthcare facilities and transport was the same( both at 8%). Only 7% of the income was spent on clothing, which accounted for the least part of expenditure.
Word count: 150
Courtesy: Mr. Surabh Kumar.