


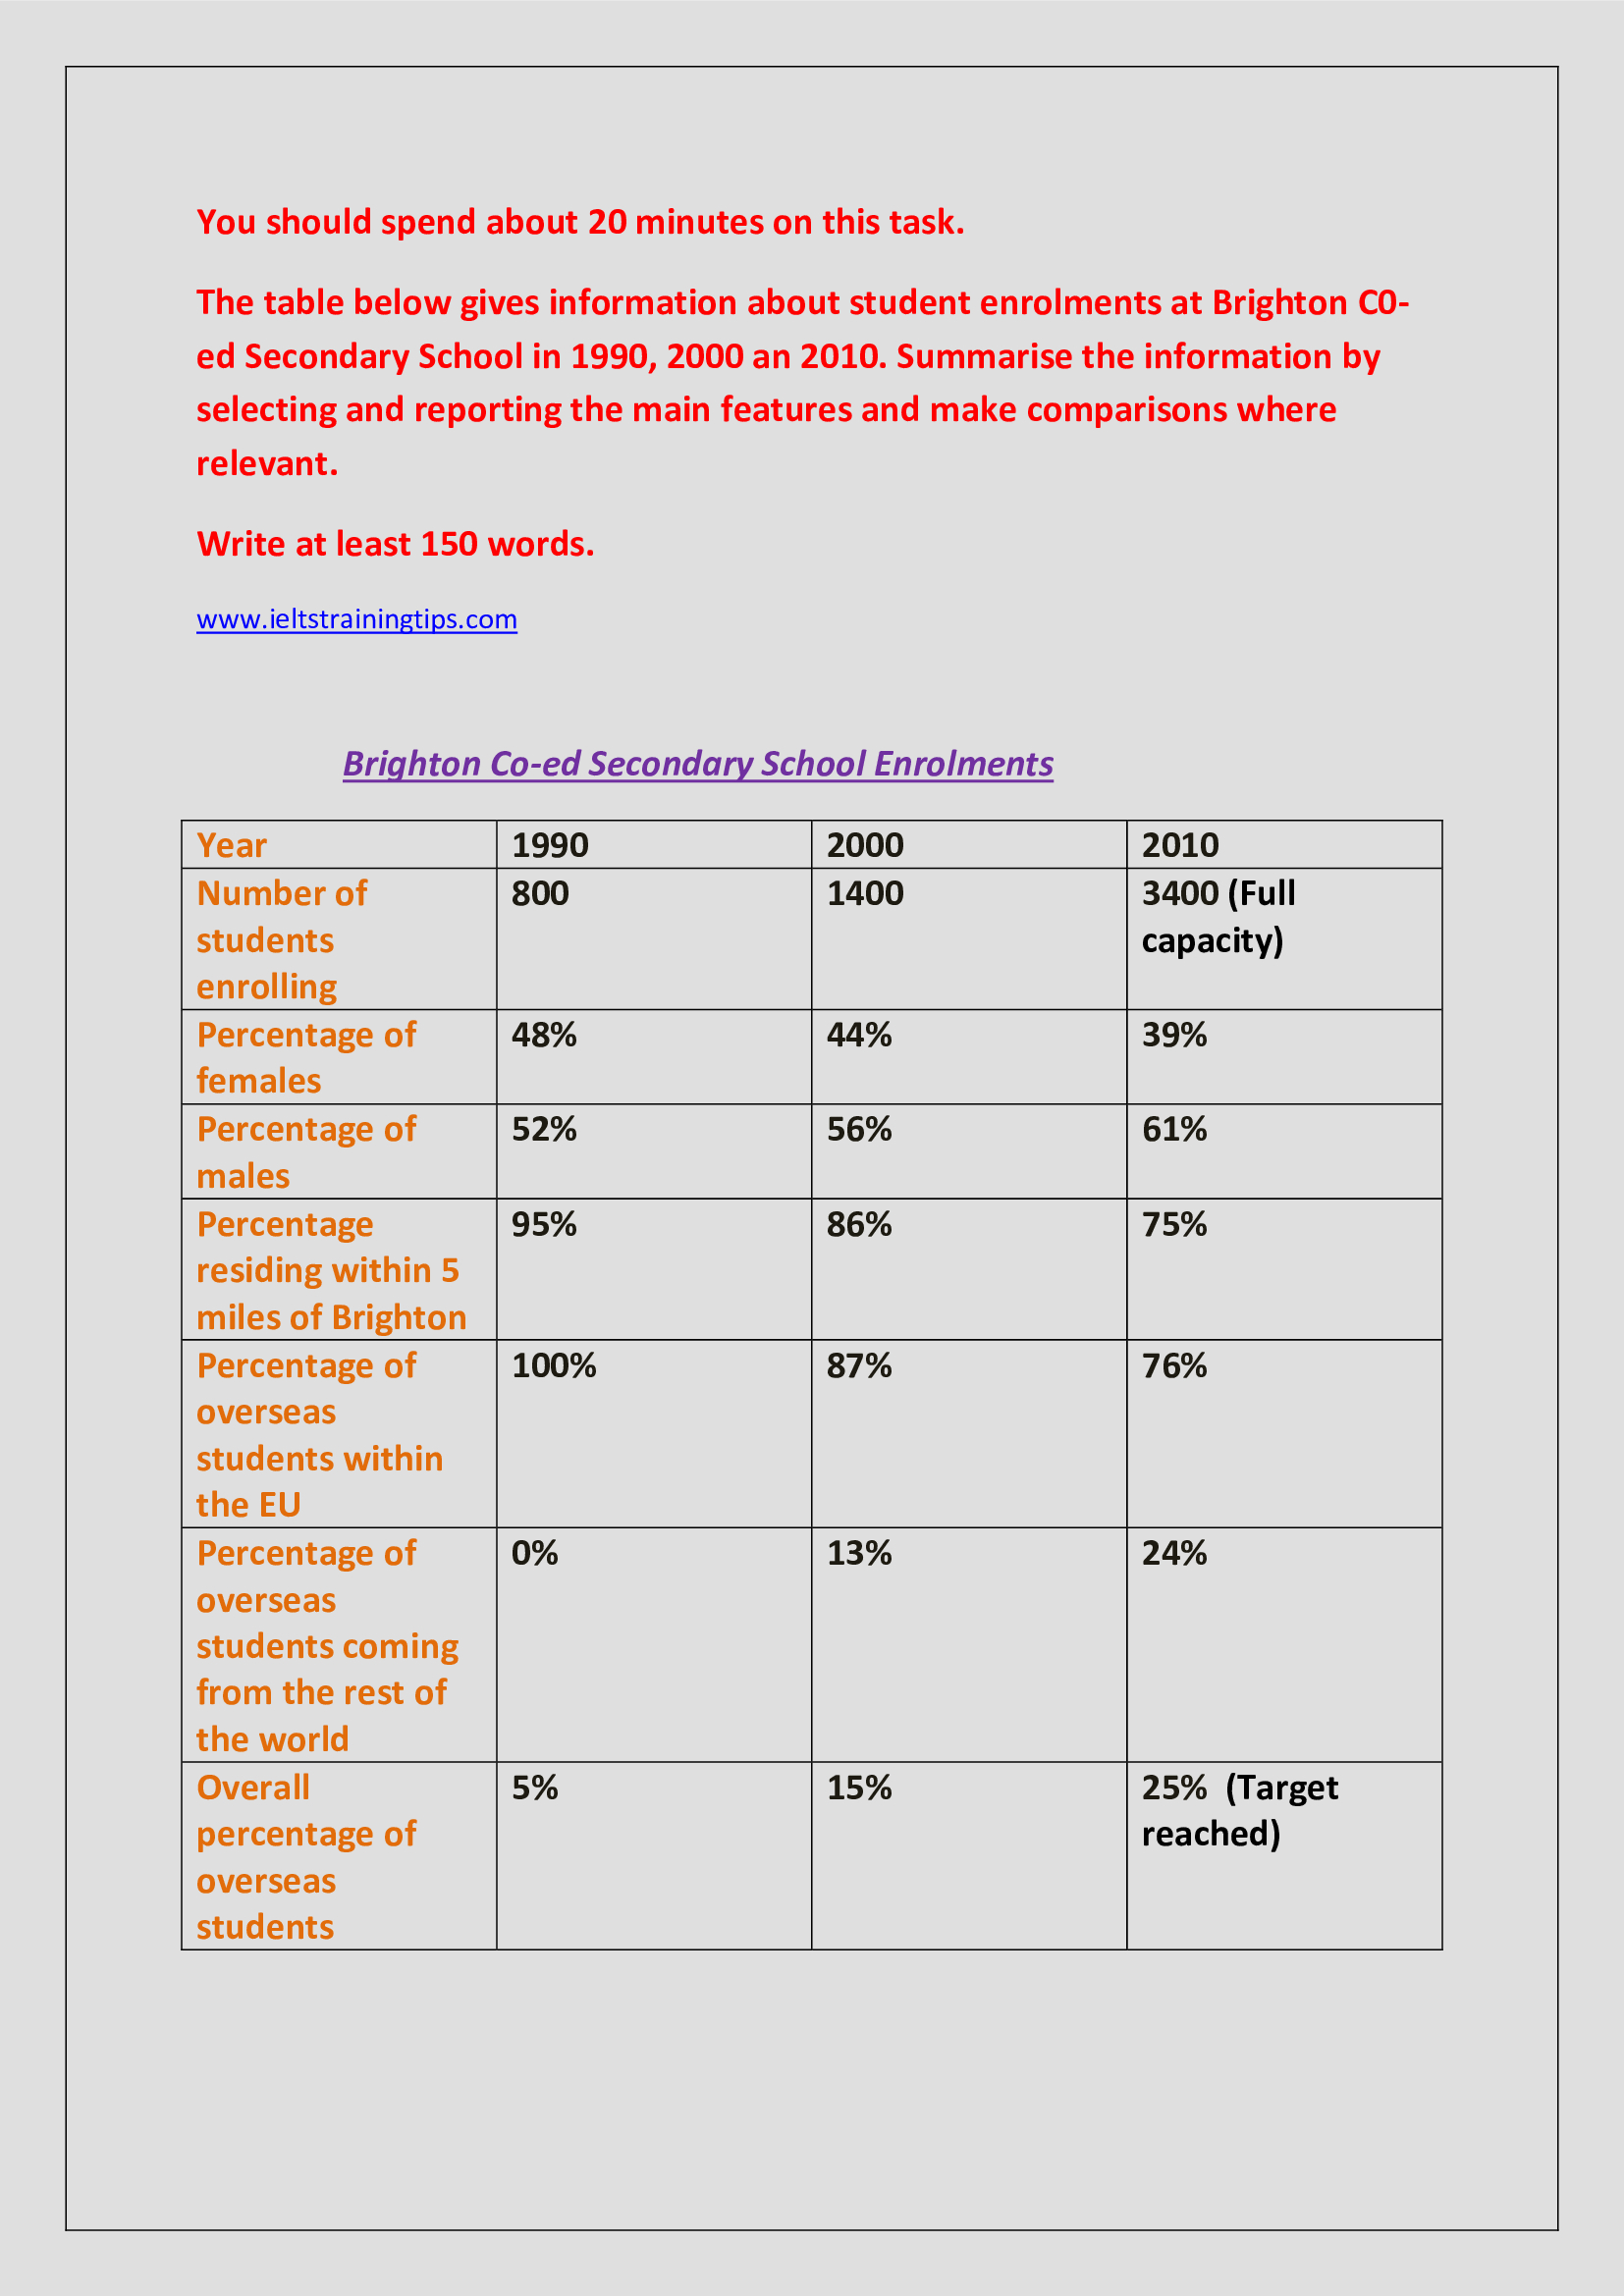
Changes in the enrolment pattern of Brighton C0-ed Secondary School in 2000 and 2010 when compared to 1990 are depicted in the given table.
Overall, it is clear that despite a decline in the number of girl students and students within EU, the school had got the full capacity and had hit its target for overseas students.
As per the table, the share of male and female enrolments went reciprocal throughout the period. When the rate of females shrank from 48 to 39 between 1990 and 2010, the male enrolment grew steadily from 52% to 61%. There was also a decline in the percentage of enrolments within EU and within 5 miles of Brighton. The former’s rate went down from 100 to 76, whilst the latter’s rate dropped from 95 to 75 over the period.
However, the enrolment rate of overseas students exhibited an increasing trend between 1990 and 2010. In 1990, the overseas students from EU were just 5%, whereas no enrolment was there from the rest of the world. From this point, the overall share of overseas students had hit the target of 25% in 2010. It should be also noted that the aggregate number of students too hit the full capacity of 3400 from just 800 in 1990.
Word count: 188