You should spend about 20 minutes on this task.
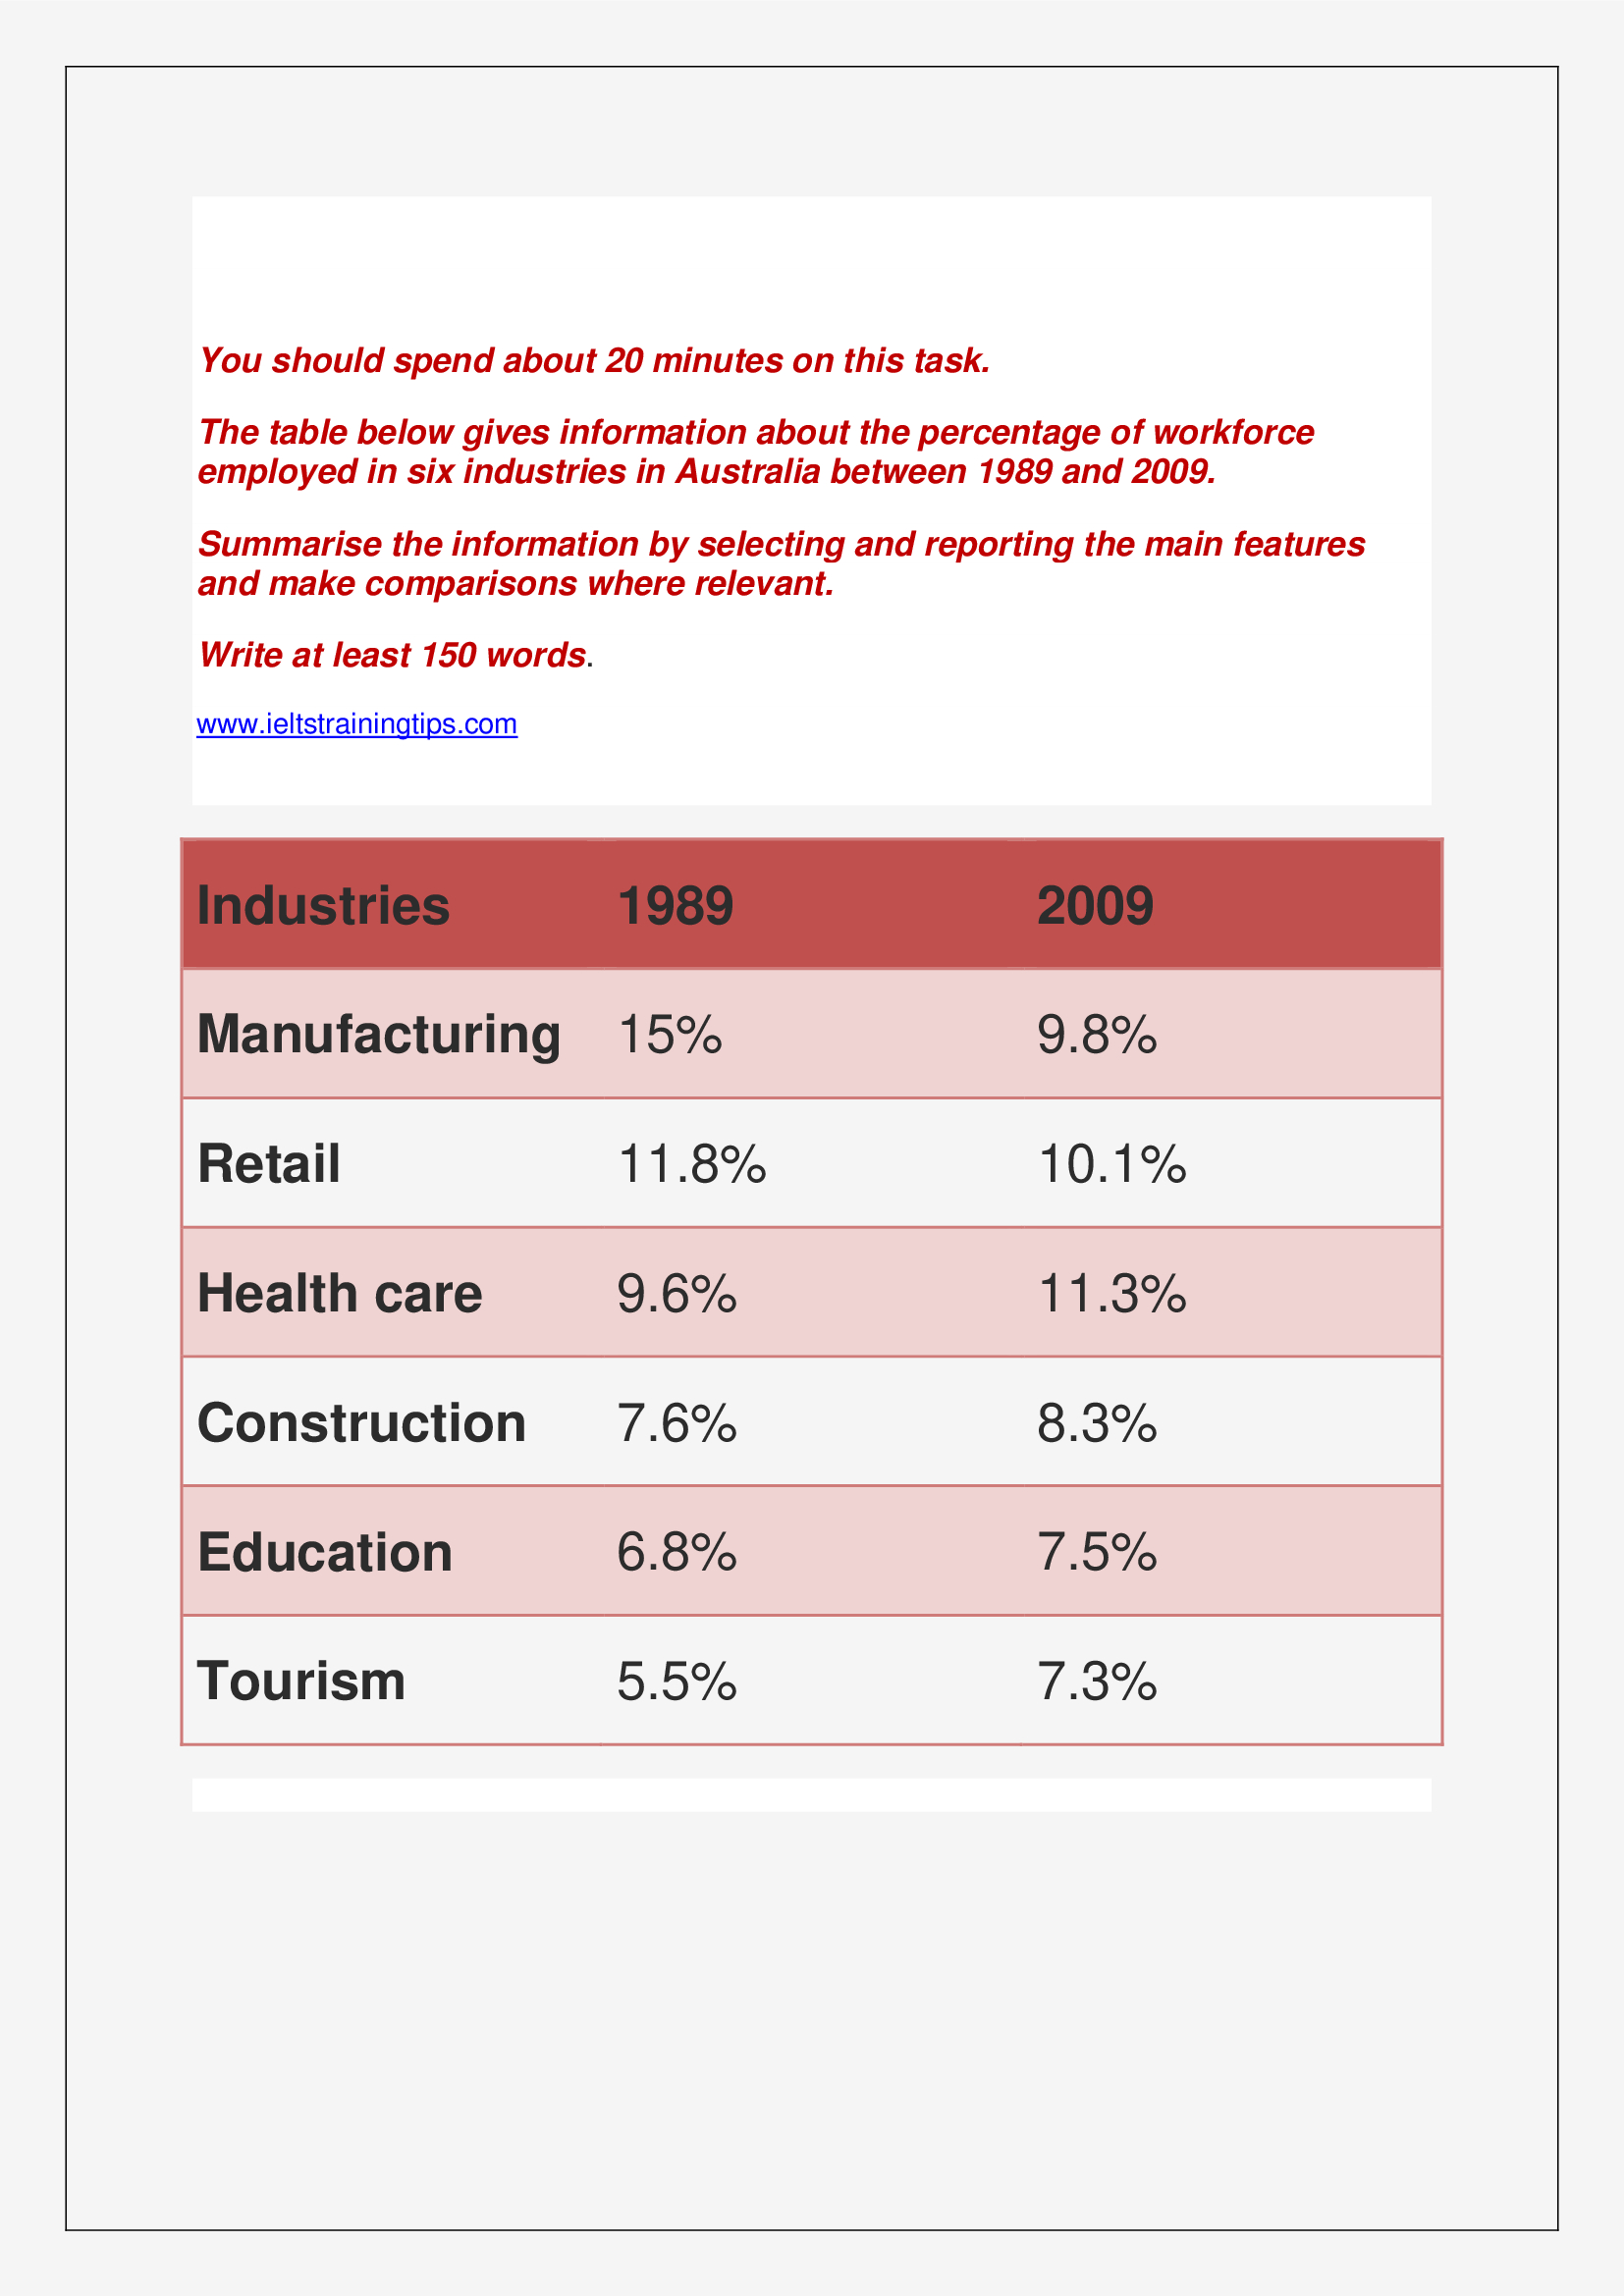
The table below gives information about the percentage of workforce employed in six industries in Australia between 1989 and 2009.
Summarise the information by selecting and reporting the main features and make comparisons where relevant.
Write at least 150 words.
The way in which the distribution of workforce in six sectors in Australia changed in 2009 when compared to 1989 is portrayed in the given table.
Overall, when the rate of workforce in the manufacturing and retail sectors exhibited a negative growth, other industries had made a positive growth between the years.
As per the table, the highest proportion of workforce in 1989 was for manufacturing industry. When it had 15% workforce, almost 3% more than the next major industry: the retail sector, the rate of workforce for the remaining four sectors was under 10. Of these four, the least workforce was in the tourism industry, at 5.5%.
In a period of two decades, the manufacturing industry saw a major setback, when its percentage of workforce fell by 5.2%. The retail sector too suffered the loss, and this was by 1.7%. However, all the other industries: healthcare, construction, education and tourism increased their workforce within a range between 0.7 and 1.8%. Of these, the biggest gainer was the tourism industry, with 7.3% workforce. Nevertheless, the highest workforce was for the healthcare sector (11.3%) in 2009.
Word count: 171