You should spend about 20 minutes on this task.
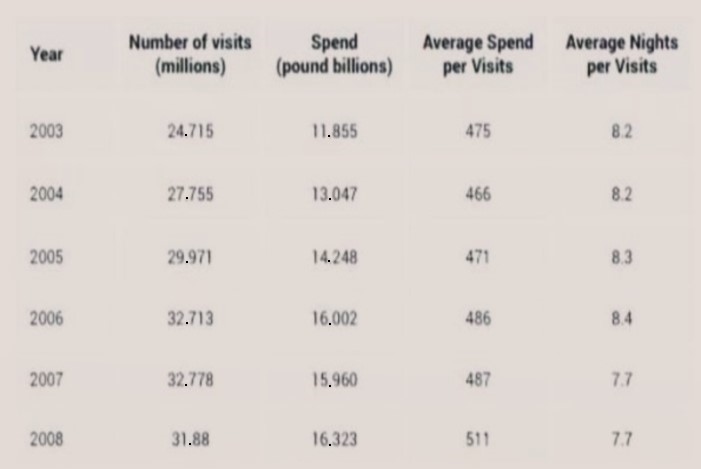
The table below shows the number of visitors in the UK and their average spending from 2003 to 2008.
Summarize the information by selecting and reporting the main features and make comparisons where relevant.
Write at least 150 words.
Information on the number of visitors to the UK, their aggregate spending, average spending per visit and average nights they stayed each visit from 2003 to 2008 is depicted in the given table.
Overall, it is clear that there was almost a proportionate relation between the number of visits and the amount spent per each visit, while the average night stay varied between the years.
As per the table, the visitor number was increasing from 24.715 million in 2003 to 32.778 in 2007. The gross spending of the visitors too went up from £ 11.855 billion in 2003 to £ 16.002 billion in 2006. Although there was a slight increase of 0.065 million visitors between 2006 and 2007, the spending declined by £ 0.042 billion. Surprisingly, when the visitor number slipped to 31.88 million in 2008, the aggregate spending went up and hit a record high of £ 16.323 billion.
When the average spending of a person per visit was increasing from £475 in 2003 to £ 511 in 2008, the average number of nights the visitors stayed varied between 7.7 and 8.4.
Word count: 155