You should spend about 20 minutes on this task.
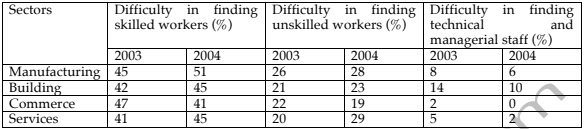
The table below shows the percentage of employers in various sectors having difficulty in finding staff in 2003 and 2004. Summarise the information by selecting and reporting the main features and make comparisons where relevant.
Write at least 150 words.
Information on the rate employers who faced difficulty in finding employees in 2004 compared to 2003 is depicted in the given table.
In general, finding technical and managerial staff was easier than finding both skilled and unskilled workers in the latter year.
In 2003, most employers had staff shortages of skilled workers. Around 47% and 45% of them found it hard to employ skilled workers from commerce and manufacturing sectors. However, the rate of job-givers who encountered difficulty in finding unskilled workers from these sectors was just 22% and 26% respectively. In case of technical and managerial staff, the proportions were just 2% and 8%. The average rates of employers who faced difficulty in finding skilled and unskilled workers from building and services sectors were 40% and 20% respectively.
However, in 2004, around 3 to 6% of more employers faced problems in enrolling skilled workers from manufacturing, building and service sectors, whereas in commerce sector, it was almost the reverse. A similar pattern is seen in case of employing unskilled staffs, but the difficulty level was higher in the service sector (which included 8% more employers). In all the sectors, technical and managerial staffs were easily available, but in the building sector, a greater proportion of employers faced the difficulty (10% compared to 14% in 2003).
Word count: 198