


You should spend about 20 minutes on this task.
MODEL ANSWER>>>
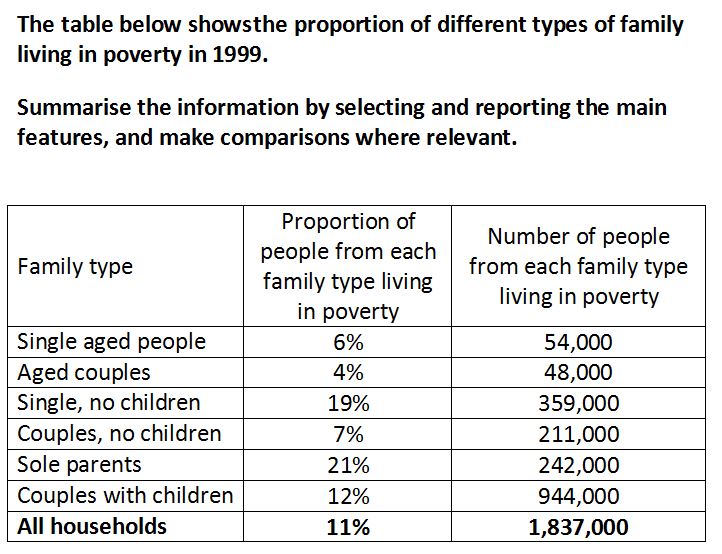
A statistical evaluation of the rate of people from different family types who lived in poverty and their numbers in 1999 is illustrated in the given table.
Overall, it is clear that families of sole parents were worst affected, while most people who were under poverty had children.
As per the table, the highest proportion of people who lived in poverty fell in the sole parent category, and this was 21. This was 9 more than couples with children and 3 more than single who had no children. When about 7% of people from families included couples with no children were affected by poverty, 10 % of families of aged (both single and couple) experienced the issue. The rate of all households who faced this crisis was 11.
Turning to the number of people who were affected from these families, most were from the families with children (sole parents + couples with children), and this was exactly 1,186,000. When about 359,000 were affected from single, no children category, the number was 211,000 in couples with no children category. The number of aged who had this issue just crossed 100,000, whereas the figure of all households came to around 1,837,000.
Word count: 185