MODEL ANSWER:
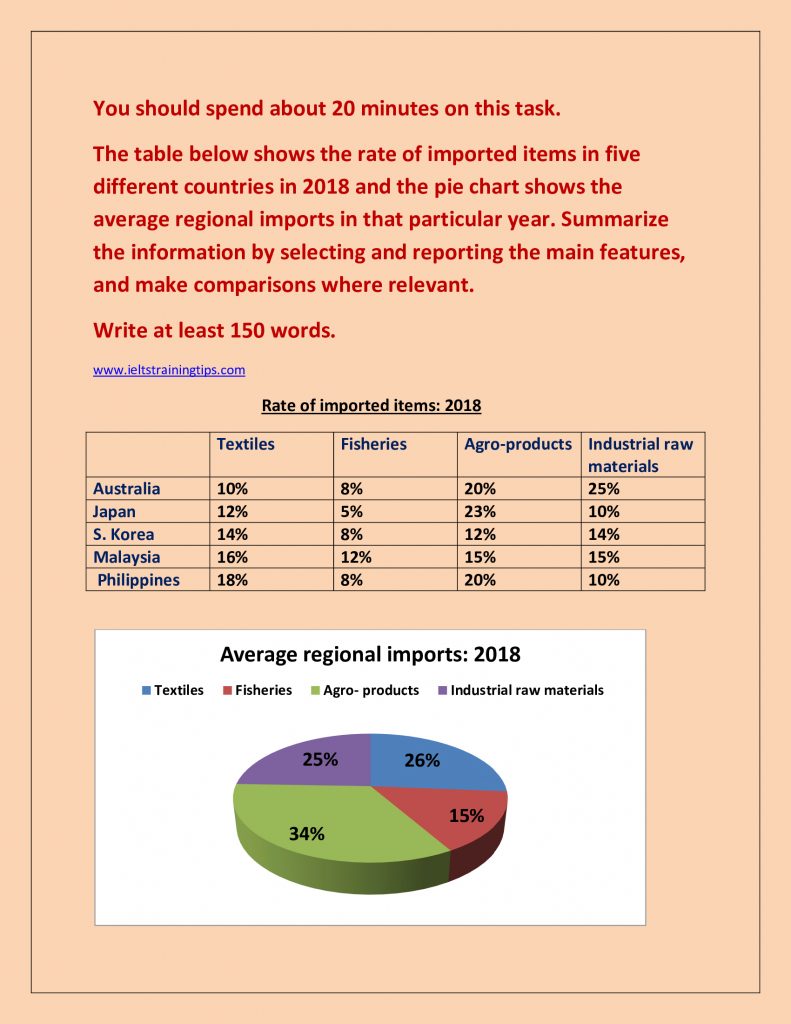
The rate of imported items in five distinct countries in 2018 and the share of average regional imports in the same year are depicted in the multiple diagrams given.
At a glance, on an average, agro- products were the popular imported items by these countries and in the region.
Of the total imports, Japan imported over a fifth of these products (23%), Australia and Philippines a fifth, and the other two countries (South Korea and Malaysia) at 12% and 15% respectively .When the industrial imports of raw materials was the highest in Australia, with almost a quarter of the country’s imports, this was between 10 and 15% in other countries.
The share of imported textile items in these countries ranged from 10 to 18, with Malaysia and Philippines as the top importers (16 and 18% respectively). Malaysia also stood first in the case of fisheries import at 12%, whereas the rate of imports in other countries stood under 10.
Turning to the pie chart, agro products recorded the highest average regional imports, which was over a third. The rate of regional imports of textiles and industrial raw materials stood at almost 25%, which was 10 more than that of fisheries (15%).
Word count: 186