


MODEL ANSWER:
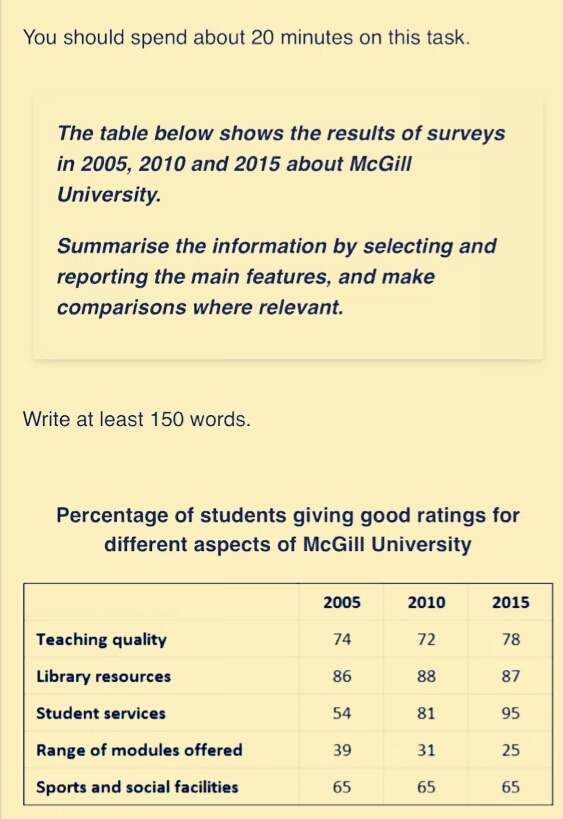
A comparison of the proportion of students who rated McGill University good for five different aspects in 2005, 2010 and 2015 is charted in the given table.
Overall the students’ rating was mostly positive in all the three years, except in case of the range of modules offered.
As per the chart, most students were very satisfied with the library resources all through the period, and the rate was between 86 and 88. A considerable proportion of students rated the quality of teaching good (between 74 and 78) despite a mere dissatisfaction in 2010 (72).
Another area where the students found themselves comfortable with was the sports and social facilities, and the satisfaction rate for this stood constant, when exactly 65% responded positively to it.
It is interesting to note that there was a considerable growth in the proportion of students who marked student’s services as good which made it the most positive aspect of the University by 2015. (The growth percentage ranged between 54 and 95).
The only exception was in the case of range of modules offered. Here, a decline is seen in the rate of students who marked it as satisfactory (from 39 to 25 between 2005 and 2015).
Word count: 185