You should spend about 20 minutes on this task.
The table gives information about department and online stores in Australia in 2011. Summarise the information by selecting and reporting the main features, and make comparisons where relevant.
Write at least 150 words.
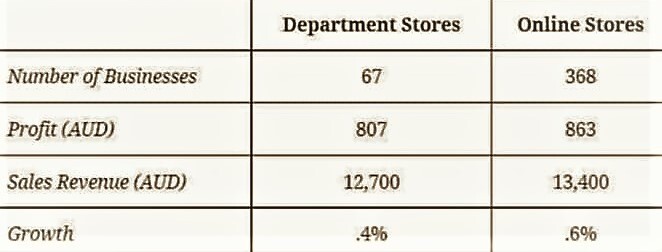
The table compares the performance of department stores and online stores in Australia in 2011.
At a glance, though the overall performance of online stores is far better in case of the number of businesses and the rate of growth, it could not hike its profit and sales revenue as department stores did.
As per the table, the visible domination of online stores is seen in case of the number of businesses it operated in 2011. This accounted for 368, which was more than five times than the number of department stores (67). The proportion of growth of online stores was also higher than the other business type. When department stores exhibited 0.4% growth, it was 0.2% more in case of online stores.
Even though department stores lagged behind online stores in both the aforementioned cases, it could perform better in earning profit and sales revenue. When these stores could gain profit more than 12 times the number of businesses it operated (AUD 807, when compared to 67 businesses), online stores could earn only AUD 863 from 368 businesses. From the same number of businesses, department stores could gain AUD 12,700, the other business could only earn AUD 13,400 as sales revenue.
Word count: 189