


You should spend about 20 minutes on this task.
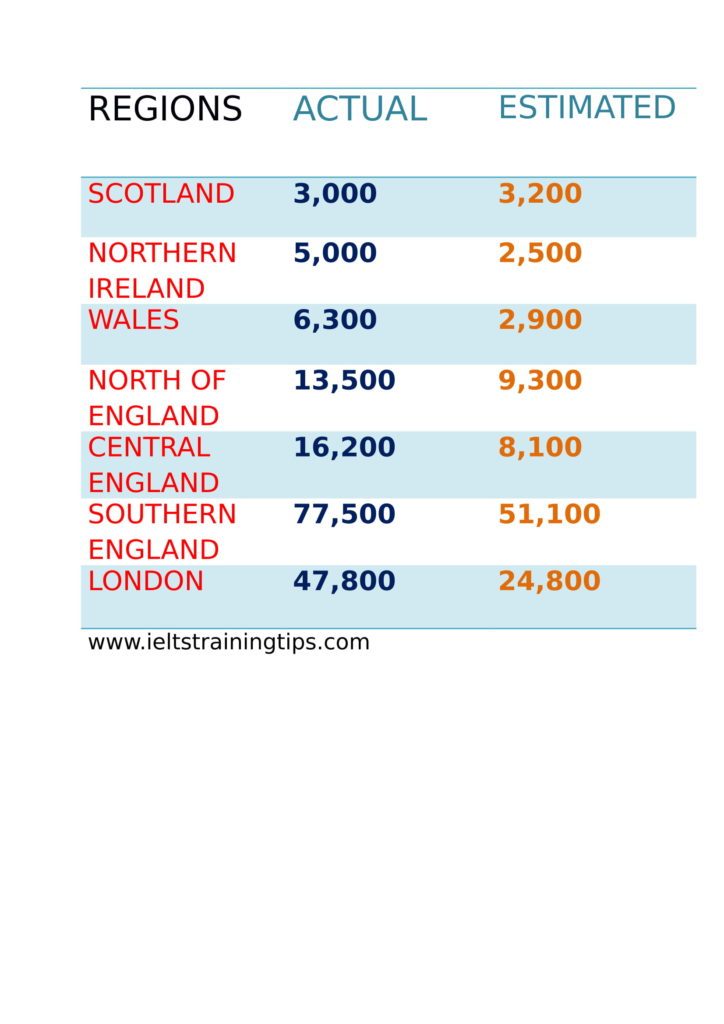
The table shows information on the number of estimated and actual numbers of houses built in the UK by region in 2015.
Summarize the information by selecting and reporting the main features and make comparisons where relevant.
Write at least 150 words.
MODEL ANSWER>>>
The difference between the estimated and actual number of houses built in the UK by region in 2015 is shown in the given table.
Overall, it is clear that the actual number of houses built in these regions was higher than the estimated number, except in the case of Scotland.
As per the table, the estimated number of houses which was set to be constructed in Southern England was more than all other regions. Here, 26,400 more houses were built than the estimated figure of 51,000. In London, the number of actual houses built was 47,800, which was 29,700 less than that of Southern England.
There was a notable difference between the number of houses built in Northern Ireland and Central England. The actual figures doubled in both cases. In case of the former region, the estimation was 2500, whilst in case of the second region, it was 8,100.
More number of houses was built in Northern England than Wales in 2015. The projected number was 9,300 in case of the former, while it was 2,900 in case of the latter. However, the numbers went up to 13,500 and 5,000 respectively.
Scotland was the only exception, when the actual number of houses was less than the projected figure. (3000:3200).
Word count:196