You should spend about 20 minutes on this task.
The tables below give the distribution of world population in 1950 and 2000, with an estimate of the situation in 2050.Summarise the information by selecting and reporting the main features, and make comparisons where relevant.
Write at least 150 words.
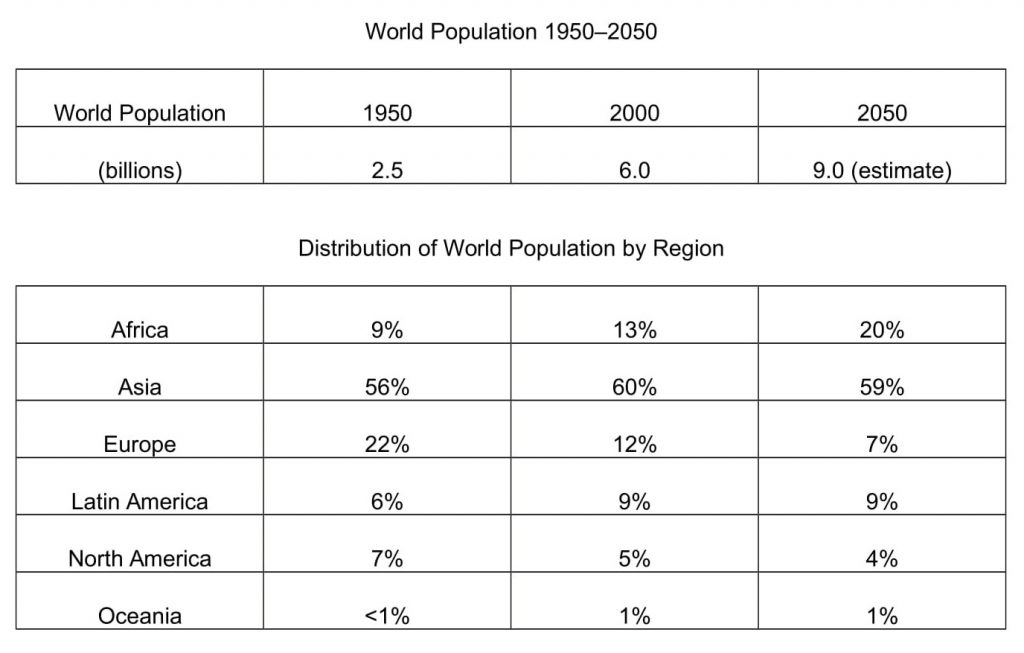
A clear cut comparison on the world population with its regional distribution from 1950 to 2000, and its projection in 2050 are illustrated in the given tables.
Overall, it is clear that when the global population is set to swell, Asia would remain the most populated continent followed by Africa.
As per the first table, population growth was exceptional between 1950 and 2000. When it grew more than double (from 2.5 to 6 billion) between the years it is anticipated to slow down, and is expected to reach 9 billion by 2050.
Out of the total global population in 1950, 56% were Asians, which was the highest. When this rose by 4%, the percentage of Europeans had shrunk from 22% to just 12% in the next 50 years. A declining trend is also seen in case of North America ( from 7 to 5%), whereas in Latin America and Oceania, it is expected to surge slightly from 6 and less than a per cent respectively.
By 2050, the global population is anticipated to see either a stagnated or negative growth, except in Africa. Its population is predicted to swell to 20% in 2050 from just 9% in 1950, and would settle as the second most populated region, behind Asia (59%). No other region of the world is predicted to contribute even 10% of the total population in 2050.