 MODEL ANSWER:
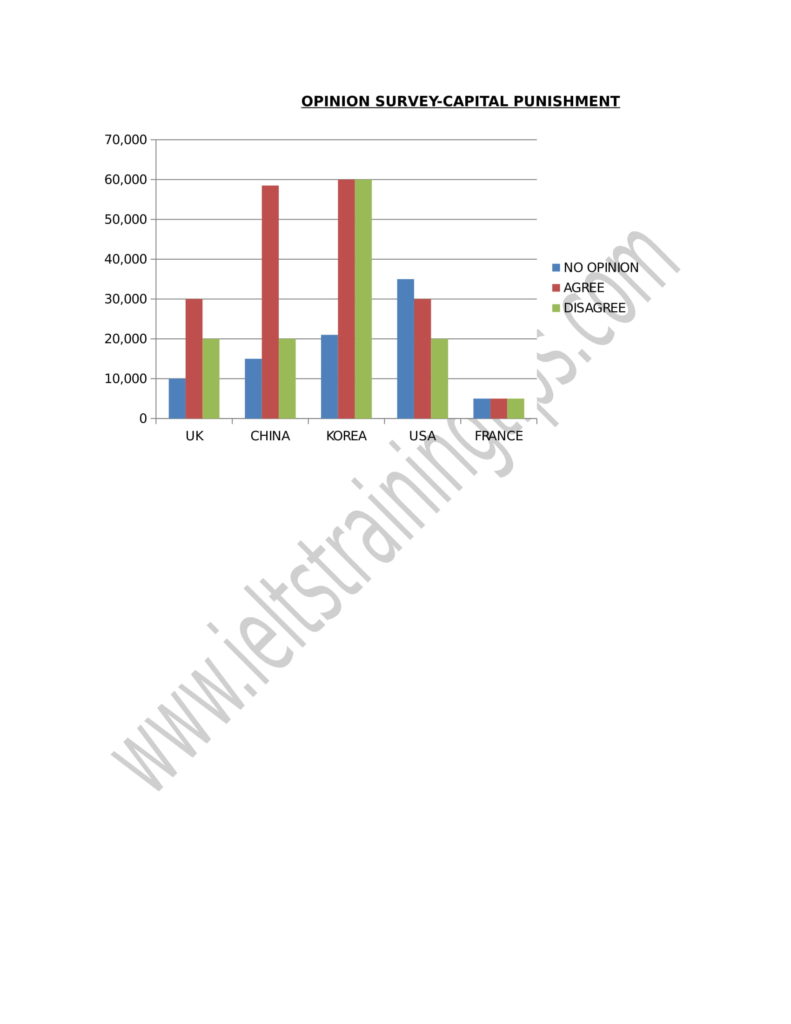
The survey result of the UN human rights commission, which was conducted among the people of five different countries in 2000 on their attitude towards capital punishment, is depicted on the given bar chart.
As can be seen from the chart, the highest number of respondents was from Korea, which constituted over 0.14 million. Around 60,000 Koreans responded “Yes” to the death penalty, while the same number of people said “No”. However, the case was different in China, where there was a wide disparity between the positive and negative responses (around 40,000). The number of people who neither agreed nor disagreed to the maximum mode of punishment in China accounted for around 15,000, which were 5,000 less than the opposers of it. This figure was 20,000 in Korea and over 30,000 in the USA. In the UK and France, their number was comparatively less, which ranged between 5,000 and 10,000.
The attitude of people towards capital punishment in the UK and the USA was similar, with nearly 30,000 supporters and 20,000 opposers. The most striking feature of the survey is seen in the case of the French respondents with the least responding figure in all the three genres (5000).
Overall, it is clear from the survey that there was more preference towards the need of capital punishment in these countries.